Small Giants

Small Giants
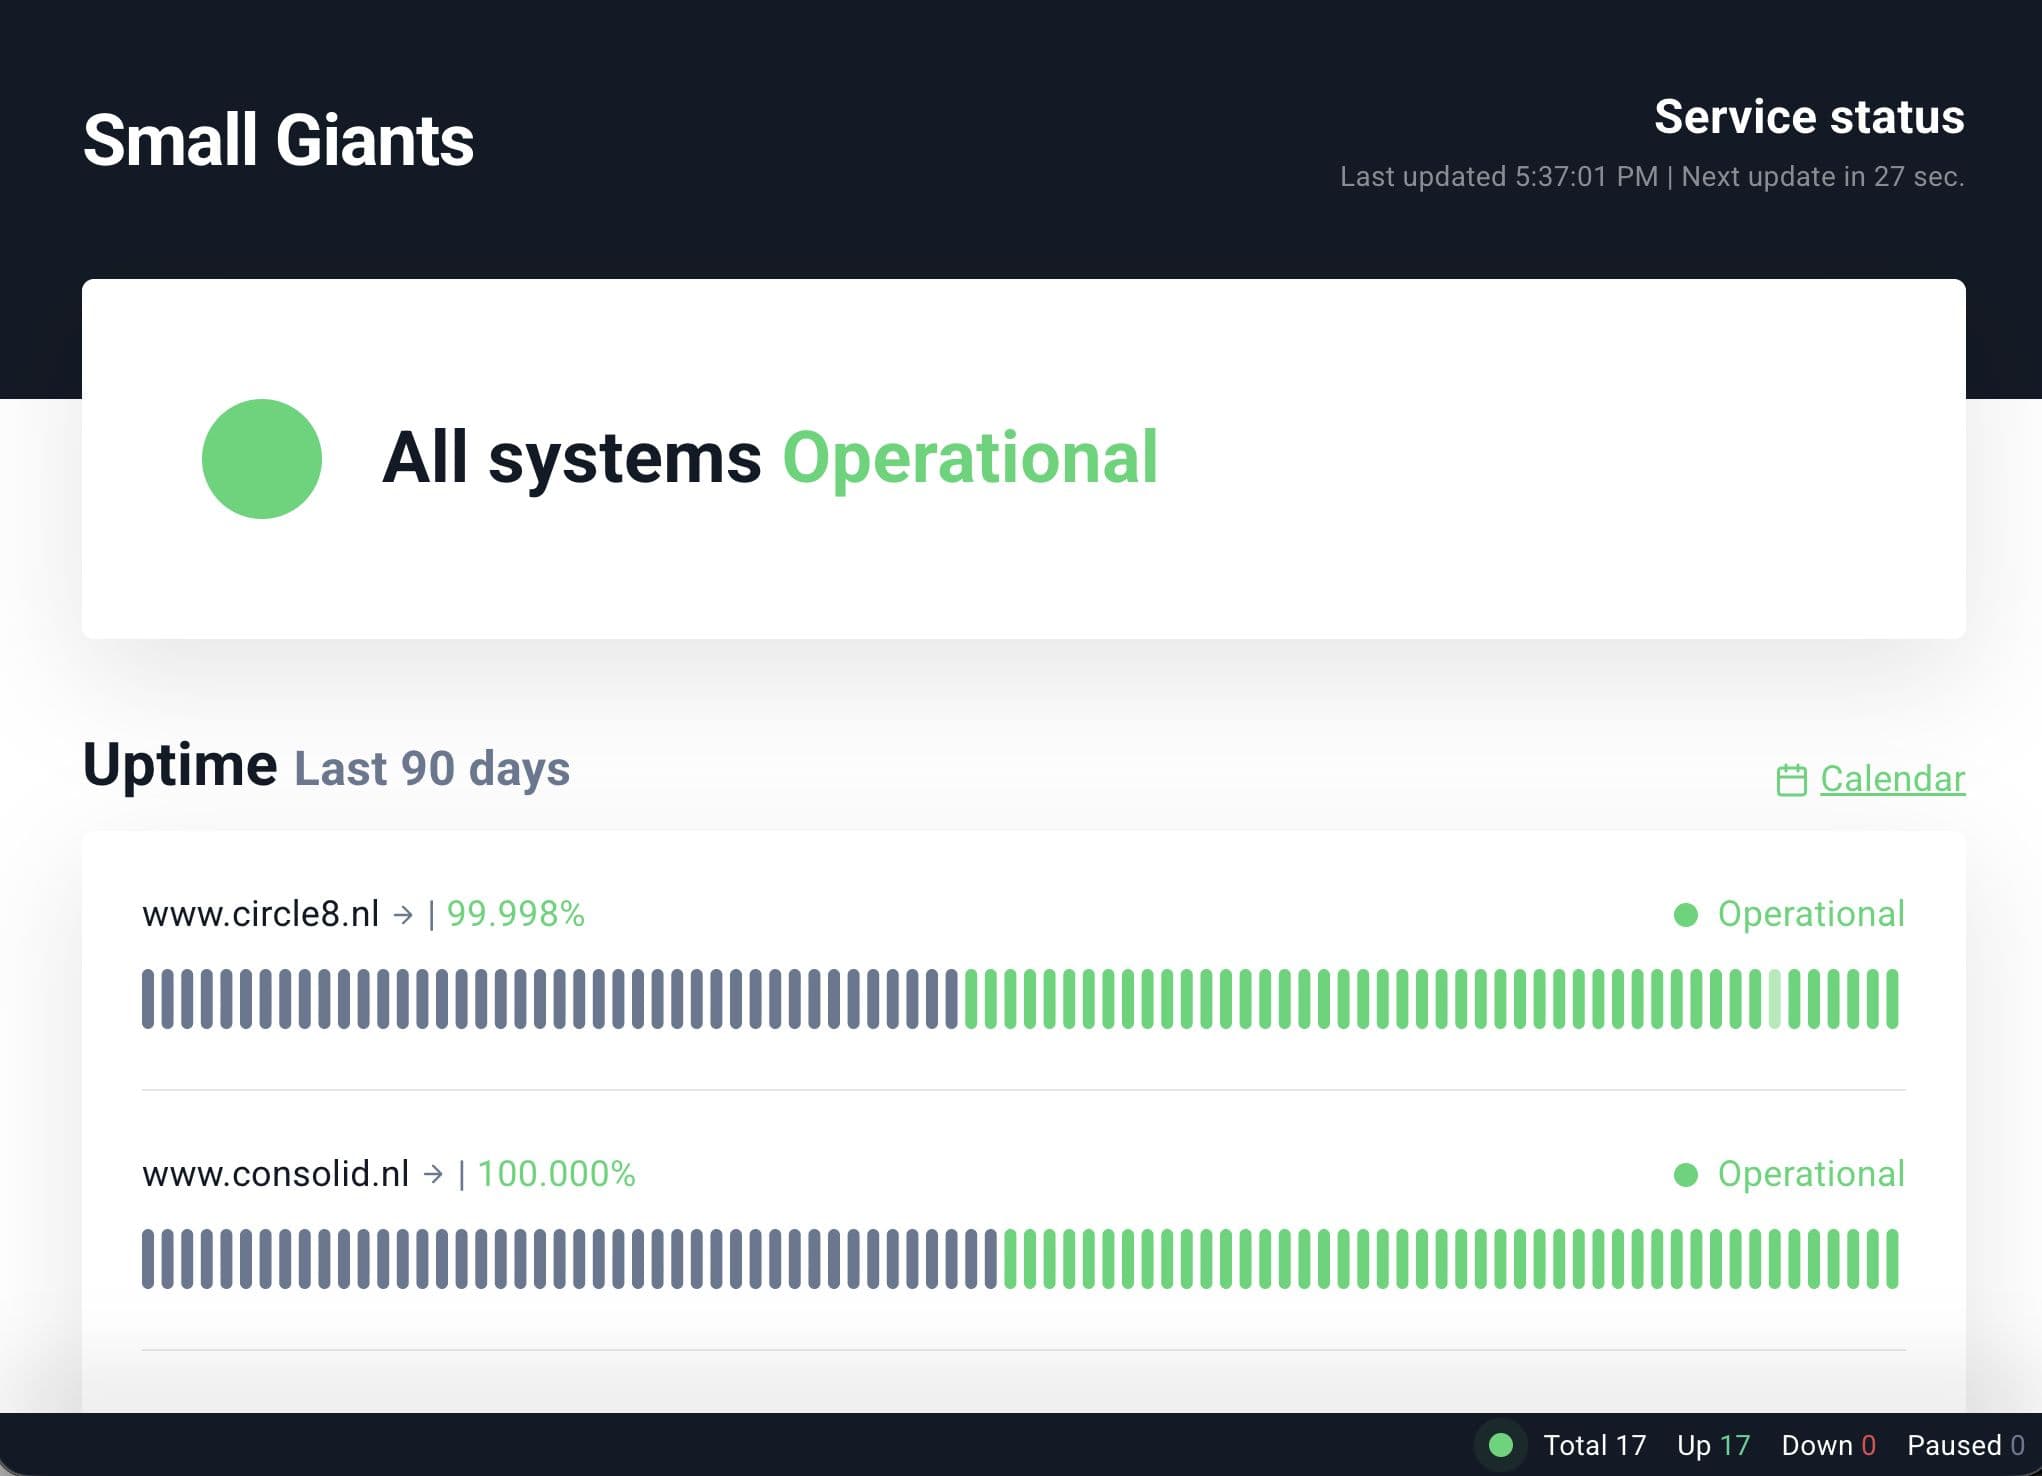
One month of monitoring across our development clients. two minutes of downtime. every second logged and reportable.
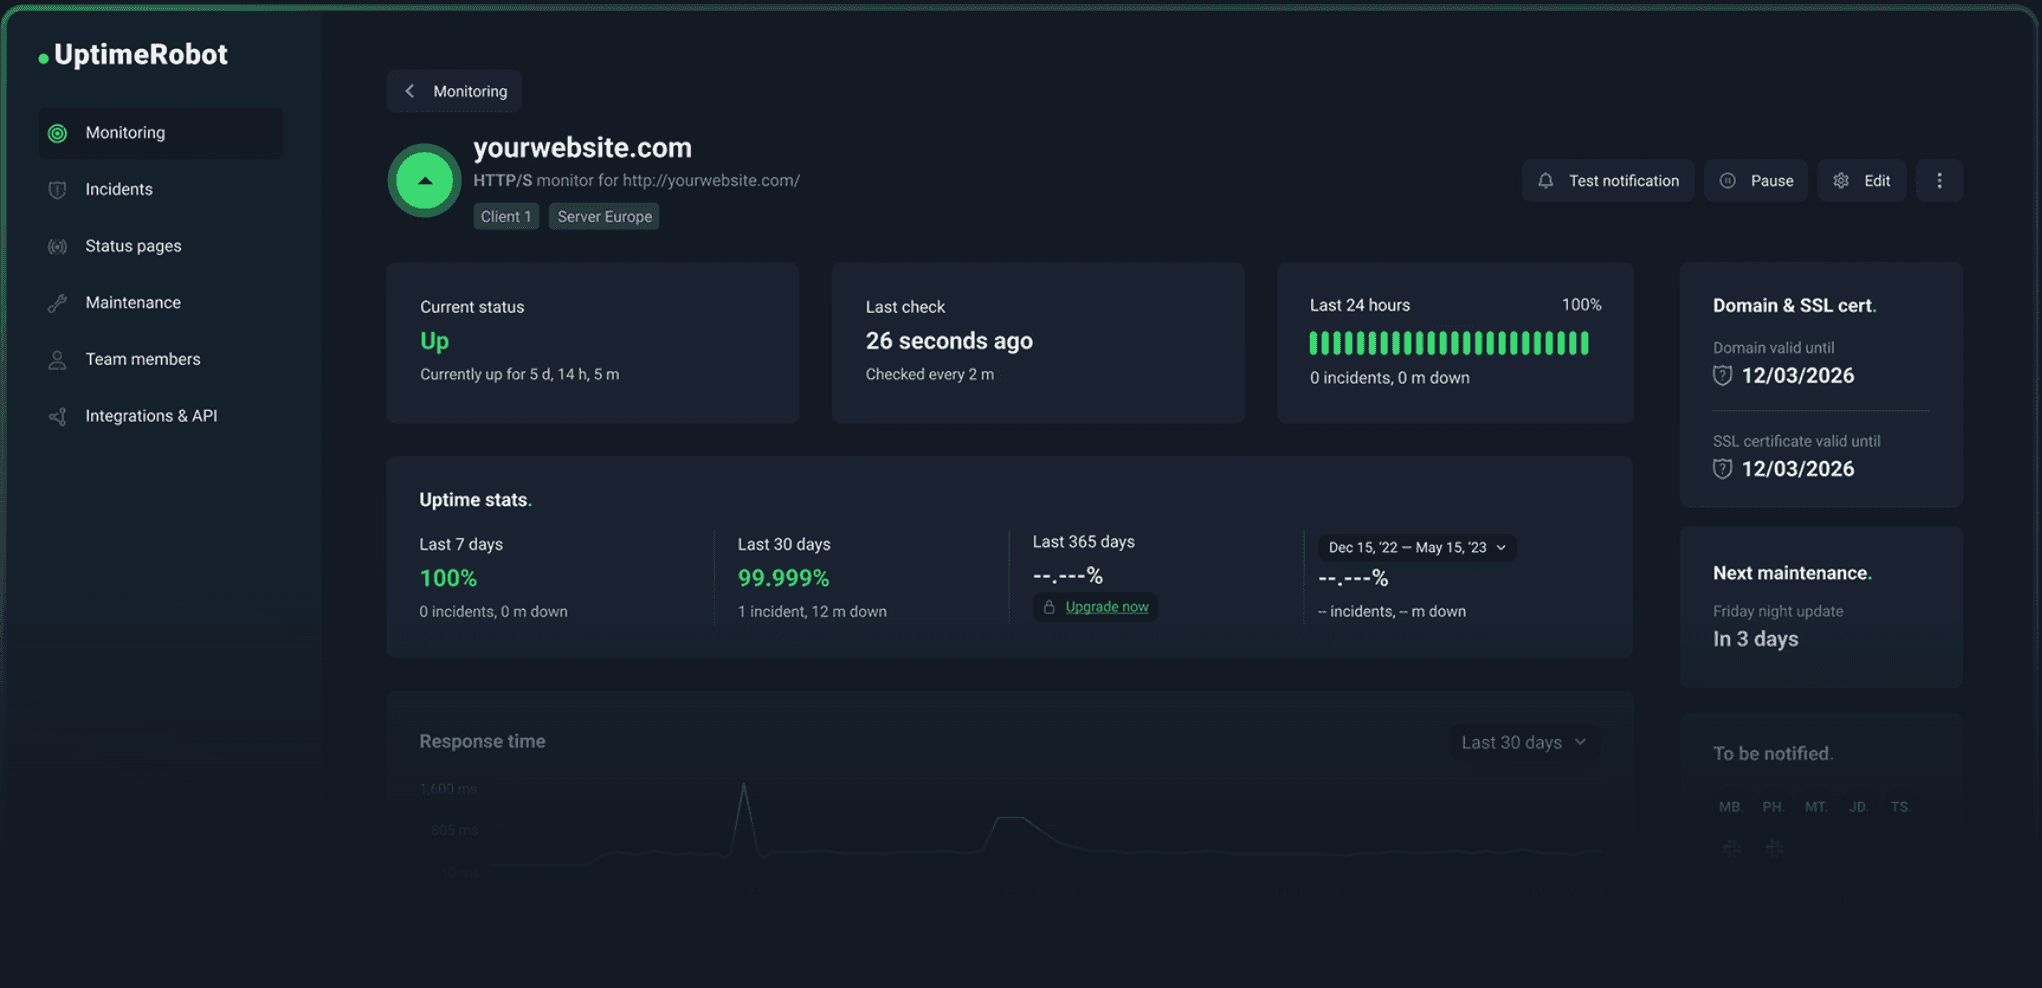
Server response time tracked continuously, with instant alerts the moment a site slows down or goes dark.
Performance is no longer a gut feeling. every client meeting now starts with a timestamped record of exactly how their infrastructure performed.

In client meetings, performance is easy to claim and hard to prove. "It's running well" is not an answer. Neither is a gut feeling or a memory of the last incident. The question is always the same: what's the data?
For development clients, uptime and response time are foundational. A slow site costs conversions. An outage costs revenue and trust. Without systematic monitoring in place, there was no real-time visibility into either.
We implemented UptimeRobot across our development client portfolio. The tool tracks server availability and response time continuously, sending instant alerts via call, SMS, and email whenever a site goes down or response time exceeds three seconds. Every incident is logged. Every uptime percentage is calculated automatically.
The next phase adds Lighthouse-based performance testing to the stack, moving beyond simple availability to track loading speed and content rendering for a fuller picture of what users actually experience.
Ready to make real impact? Let’s connect.
